How it works
General
President
Senate
House
FAQ
Purpose
The upcoming 2024 US elections will determine which party controls the presidency, senate, and house. Various outlets assign ratings to each individual
race to indicate which party is more likely to win, and some even aggregate those ratings into an overall model of which party is more likely to win
the presidency and/or control congress. However, the actual math behind such models tends to be pretty ambiguous.
The purpose of this site is to provide a simple, transparent, and customizable model of these elections, mostly for fun, to play around with arbitrary "what if"
scenarios.
Simulating Elections
When the page is loaded, and any time a race rating is subsequently changed, thousands of "election nights" are simulated.
In each of those, for each race, a winner is decided (based on the race's rating and a generated random number), the state's electoral votes (or senate/house seat)
are allocated appropriately to per-party totals for that election night, and once all races are processed, whichever party has at least 270 electoral votes
(or 51 senate seats, or 218 house seats) wins on that election night.
The overall probabilities are then computed by simply dividing the number of a party's wins by the total number of simulated election nights
(though note that the overall probabilities often fluctuate by 1% due to a combination of luck and rounding).
Apparently this is called a "Monte Carlo" simulation.
Ratings
The site uses the following ratings:
Environments
You might reasonably be wondering what the functional difference is between the "Certain" and "Lock" ratings.
So, taken alone, the ratings above imply an assumption that within a single election night, the individual races are completely independent from one another.
In practice though, if one party exceeds expectations in one state, they're more likely to also exceed expectations in others, as the flawed expectations could
have been based on widespread errors in polling methods or turnout models.
For that reason, for each simulated election night, an "environment" is first (randomly) selected, which can apply modifiers to the various ratings
for all races of that election night.
Environments that apply large modifiers are less likely to be used:
The interactions between ratings and environments are summarized in the following table:
The net effect is to nerf the overall chances of whichever party is more likely to win in a neutral environment,
because that party has fewer opportunities for a favorable environment to convert losses into wins (i.e., they have fewer losses in the first place).
You can force the simulations to use a particular environment for all election nights.
Note that forcing a "Neutral" environment effectively disables the feature,
but this may make sense if you're setting your own ratings and want a finer amount of control.
Default Ratings
For the presidential race, the default state ratings are based on recent polls (up to 4), along with the final results from 2020 as a "base".
Note that any polls are averaged together, and then the polling average is separately averaged with the 2020 result.
In that way, polling and the base will each account for half of the final score, which gets converted into a rating according to the following table:
Computed Lead
Rating
Less than 2 points
Tossup
At least 2 points
Tilt
At least 4 points
Lean
At least 6 points
Likely
At least 8 points
Solid
At least 10 points
Certain
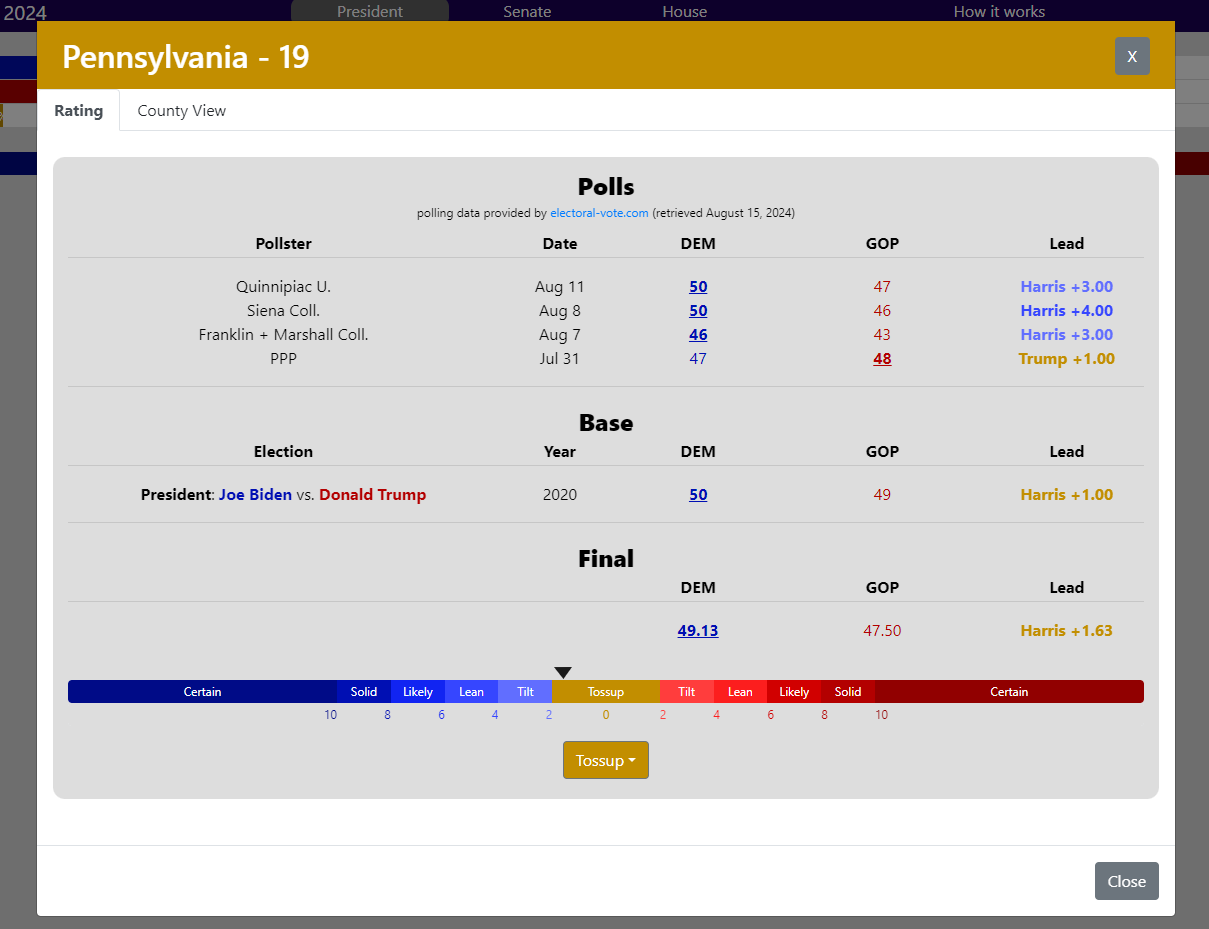
With "quick-set" disabled, you can view the polls of a state by clicking on it in the map. For example:

In this case, Kamala Harris has an average polling lead of (-1.00 + 3.00 + 4.00 + 3.00) / 4 = 2.25, and then averaging that with the base lead results
in a final score of (2.25 + 1.00) / 2 = 1.63 (or technically 1.625, but you know what I mean), which corresponds to a default rating of "Tossup".
Electoral Votes
A state's number of votes in the electoral college is primarily a function of its population, except every state is guaranteed to have at least three. More precisely, a state
gets one electoral vote for each senator (every state has two) and for each seat in the house of representatives (based on population, but every state has at least one).
The District of Columbia (DC) gets three electoral votes as well, even though it technically doesn't have any congressional representation.
That means there are a total of 538 electoral votes (435 house seats + 100 senators + 3 from DC), which is why 270 (half plus one) is the number to win the presidency.
Maine and Nebraska
These are the only states that don't award all of their electoral votes in a winner-take-all fashion. Rather, there are effectively separate elections for the state
at-large (worth 2 electoral votes) and for each congressional district (each worth 1 electoral vote).
There aren't really polls at the congressional district level, so I've just set those default ratings manually based on historical data.
In quick-set mode, those ratings can be changed by clicking on the little squares.
In the Event of a Tie
If each party ends up with exactly 269 electoral votes, the presidency is decided by a vote of the incoming house of representatives, except with each state
delegation voting as one (meaning California and Wyoming would presumably cancel each other out, for example). The vice presidency is decided by a vote of the
incoming senate.
Yeah hopefully it doesn't come to that...
County View
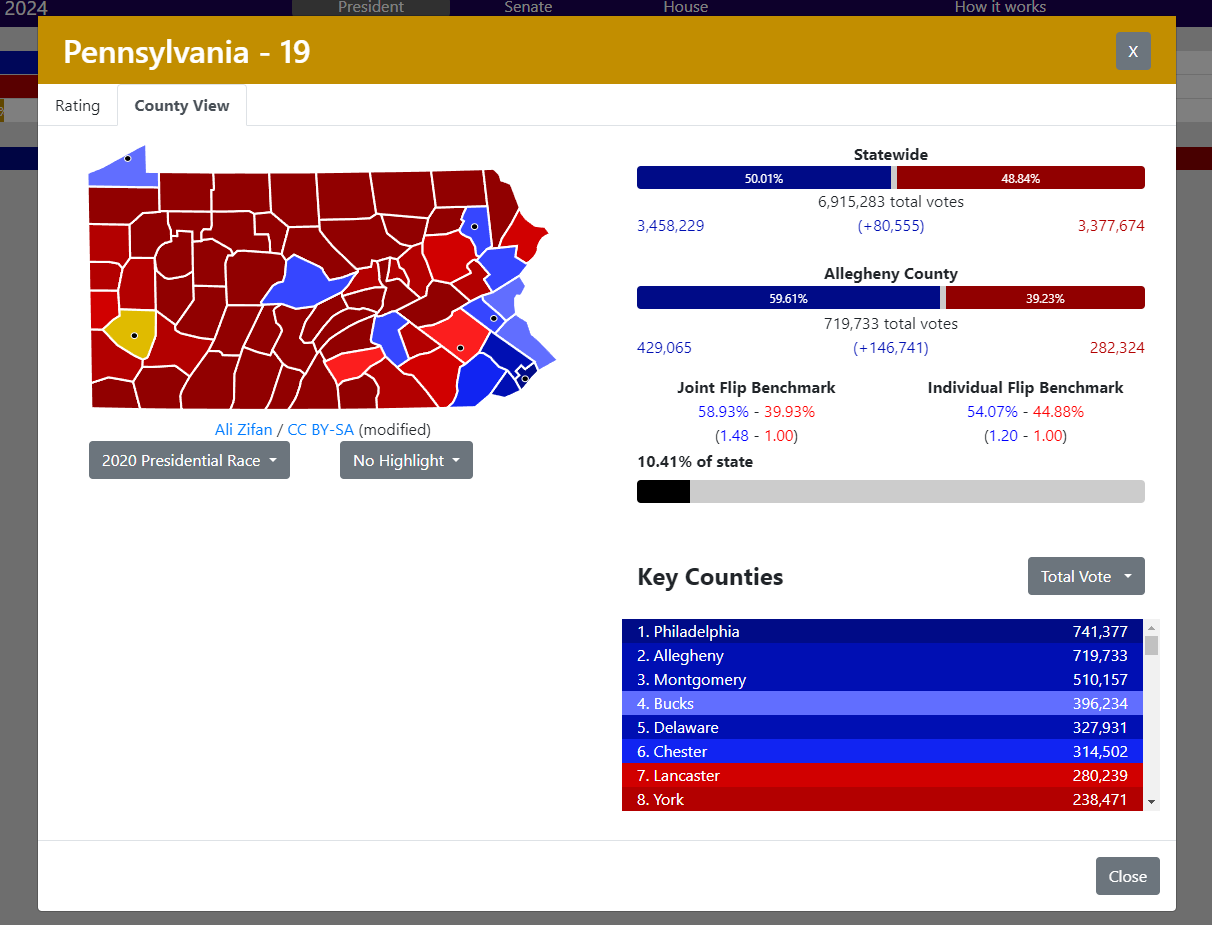
Clicking the "County View" tab will open up a county-level map of the selected state,
and hovering over any county will give something like this:

This shows a comparison of the highlighted county's 2020 results to those of the state overall.
For each county, there are also two separate "benchmarks" given. So with Pennsylvania, for example, Joe Biden won the state in 2020 by 80,555 votes, and we can
ask the question "how many votes would need to have been converted to his opponent in order for him to have lost?".
With the Joint Flip Benchmark, these conversions are distributed proportionately across all counties in the state, and the selected county's result in that
scenario is displayed. Put another way, ignoring changes in population and turnout rates between 2020 and 2024, Kamala Harris could be generally considered "on pace"
to win Pennsylvania in 2024 so long as she does better than 1.48 - 1.00 in Allegheny County
(and so long as she meets or exceeds the Joint Flip Benchmark in all other Pennsylvania counties).
With the Individual Flip Benchmark, the conversions are concentrated exclusively in that single county. Put another way, if Kamala Harris
doesn't end up going at least 1.20 - 1.00 in Allegheny County, she'll
be in real big trouble. Note that a county will generally only have an Individual Flip Benchmark if it's a
relatively large county in a close state (otherwise the county won't have enough votes available for conversion to make up the statewide deficit).
The idea is that as real votes from key counties start to be reported on Election Night 2024, you can compare them to these benchmarks to
get an idea of whether the state is on pace to flip.
Now you too can live out your fantasies of being John King.
Default Ratings
The default ratings for each senate race follow the same formula as the default ratings for the presidential race (average of the four most recent polls, averaged
with a "base" actual result). In cases where no incumbent senator is running for re-election, the 2020 presidential race is used as the base. When an incumbent senator
is running, the result from their 2018 election is used instead.
Admittedly using 2018 results to inform 2024 ratings may end up painting an excessively rosy picture for Democratic senate candidates, as 2018 was a notably
strong year for their party. Eventually though this should get mitigated by current polling results (once I have those available), and beyond that you can
certainly feel free to adjust ratings accordingly.
In the Event of a Tie
If each party ends up with exactly 50 seats, control of the senate effectively goes to the party whose candidate won the presidential election,
because ties in senate votes are broken by the vice president.
Default Ratings
There isn't a lot of publicly-available polling for house races, so for those default ratings I defer to the
Cook Political Report.
However, note that I map their "Solid" ratings to my "Certain" ones.
PVI
When highlighting a district, next to its rating, you'll see a letter and a number, for example R+3.
This is the PVI for that district.
PVI stands for "Partisan Voting Index". Borrowing from wikipedia:
PVIs are calculated by comparing a congressional district's average Democratic or Republican Party share of the two-party presidential vote in the past two presidential elections to the national average share for those elections. For example, the national average for 2004 and 2008 was 51.2% Democratic to 48.8% Republican. In Alaska's at-large congressional district, the Republican candidate won 63% and 61% of the two-party share in the 2004 and 2008 presidential elections, respectively. Comparing the average of these two district results (62%) against the average national share (48.8%), this district voted 13.2 percentage points more Republican than the country as a whole, or R+13.
PVIs are calculated by comparing a congressional district's average Democratic or Republican Party share of the two-party presidential vote in the past two presidential elections to the national average share for those elections. For example, the national average for 2004 and 2008 was 51.2% Democratic to 48.8% Republican. In Alaska's at-large congressional district, the Republican candidate won 63% and 61% of the two-party share in the 2004 and 2008 presidential elections, respectively. Comparing the average of these two district results (62%) against the average national share (48.8%), this district voted 13.2 percentage points more Republican than the country as a whole, or R+13.
In general, the PVI of a district is a good indicator of which party will win control the seat. It's not perfect though. For example, an incumbent and moderate
Democrat may be a safe bet to win in an R+3 district. Also note that if in the past two presidential elections, Democrats got 52% of the
two-party vote share nationwide, then an R+1 district would in absolute terms still be
51 - 49, since the R+1 is
relative to the national average.
What polling data do you use?
The good people at electoral-vote.com are kind enough to provide downloadable polling data,
so that's what I use.
You can read about their standards for which polls they include here.
Why is there no county view for Alaska?
Alaska historically doesn't track county-level vote data. They also call them "boroughs", but that's not really a problem. Just look at Louisiana.
Where is the Nebraska special senate election?
Nebraska technically has both of its senate seats up for election this year. But given how heavily Republican-leaning Nebraska is, it honestly wasn't
worth the trouble of refactoring the code to model that. The Nebraska special election is taken by the simulation to be "Lock Republican", which is
already a perfectly accurate characterization.
What do ferrets have to do with anything?
When used as a verb, "ferret" can mean "to search about".
Mostly it's a reference to this adorable (and sadly, seemingly defunct)
government tool
that I used one time for a college project.